Port Coquitlam presents a unique challenge for compaction control because the soil profile shifts dramatically between the flatlands along the Pitt River and the glacial till benches rising toward Burke Mountain. In the Dominion Triangle, we routinely encounter silty clays that hold moisture differently than the sandy gravels found near the downtown core on McAllister Avenue. A standard Proctor curve developed for one area rarely applies to the other. That is why our field density test using the sand cone method is calibrated site by site. We pair it with a grain size analysis when the borrow source changes, and we often cross-check results with a plate load test on structural fill where the bearing criteria are more demanding than simple percent compaction.
A sand cone test measures the entire lift, not just the surface 50 millimeters. That vertical integration is what makes it the referee method on a Port Coquitlam earthworks job.
Service characteristics in Port Coquitlam
Local geotechnical conditions in Port Coquitlam
The most costly mistake we see on Port Coquitlam sites is relying exclusively on a nuclear density gauge without running sand cone correlations on the first three lifts. The fine-grained fills from the Mary Hill Bypass borrow pits contain mica and organic traces that affect the gauge calibration, and an uncorrected reading can overestimate compaction by 5 to 8 percent. That error remains invisible until the pavement shows rutting after one winter of heavy truck traffic. A second common failure is testing only the center of the trench while ignoring the haunch zones beside the pipe. Those zones are compacted with hand tampers and typically fall 4 to 6 percent below the main lift density. Our protocol maps the entire cross-section, and we flag any zone that falls below the NBCC Part 4 or municipal specification before the next lift hides the evidence.
Our services
Our field density program in Port Coquitlam is designed to move at the pace of the earthworks crew. We show up within a 2-hour call window, run the sand cone, deliver the density and moisture results before the next compactor pass, and file the stamped report the same evening.
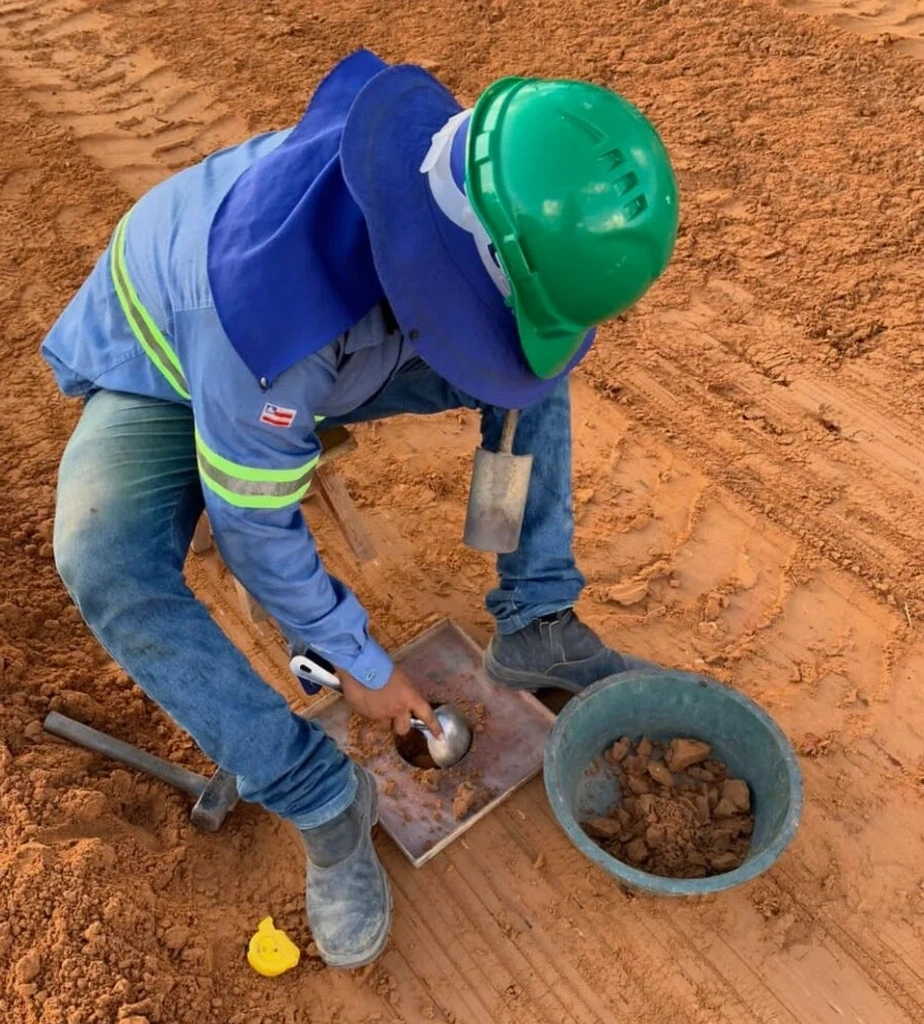
Sand Cone Density Testing
ASTM D1556 field density on trench backfill, building pads, and road subgrade. Includes moisture content, dry density calculation, and percent compaction against the project Proctor curve.
Proctor Compaction Curves
Standard Proctor (ASTM D698) on site-specific borrow material. We run a new curve whenever the soil source changes, which is common when moving between the Pitt River and Burke Mountain zones of Port Coquitlam.
Nuclear Gauge Correlation
Side-by-side sand cone and nuclear gauge readings to build a site-specific calibration. Required by many Lower Mainland municipalities before accepting gauge-only testing for production lifts.
Quick answers
What does a field density test cost in Port Coquitlam?
A single sand cone test on a residential or light commercial site in Port Coquitlam typically falls between CA$120 and CA$210, depending on the number of tests per mobilization and whether a Proctor curve already exists. Volume pricing applies for large earthworks projects with daily testing schedules.
How many sand cone tests does the City of Port Coquitlam require per lift?
The City of Port Coquitlam Engineering Design Standards generally require one test per lift per 300 square metres of trench or fill area, with a minimum of one test per day per active work zone. Critical zones like pipe haunches and manhole backfill may require additional tests at the inspector's discretion.
Can the sand cone be used in gravelly soils near the Coquitlam River?
Yes, but with a caveat. ASTM D1556 limits the sand cone to soils with a maximum particle size of about 38 mm. If the gravel fraction exceeds that, we switch to a water replacement method or use a larger test ring. We assess the gradation first, often with a quick grain size analysis, before committing to the method on site.
How soon do we receive the density report after testing?
We issue a PDF report the same day. The report includes the field dry density, moisture content, percent compaction relative to the Proctor curve, GPS coordinates of the test location, and a note on any visual observations such as oversized material or moisture streaks. Stamped final reports follow within 24 hours for the project record.